



During the Great Depression, roughly one in four people in the labor force was unemployed, according to the St. Louis Federal Reserve's economic history curriculum. Yet unemployment alone doesn't explain why a retirement portfolio might struggle in a crisis. The useful comparison between the 2008 recession vs Great Depression separates economic scale, financial-system mechanics, and the timing of retirement withdrawals, rather than treating every crash as the same event.
2008 Recession vs Great Depression by the Numbers
A downturn's scale matters, but its mechanism matters for retirement decisions. Falling prices, lost income, tighter credit, and forced investment sales create different pressures on withdrawals and portfolio allocation.
2008 Recession vs Great Depression by Key Measure
| Measure | Great Depression (1929–1933) | Great Recession (2007–2009) |
|---|---|---|
| Real GDP change | −26.7% during 1929–1933, according to the Congressional Research Service comparison | −4.1% during 2007 Q4–2009 Q2, according to the Congressional Research Service comparison |
| Price level change | −25.5% during 1929–1933, deflation, according to the Congressional Research Service comparison | +2.5% during 2007 Q4–2009 Q2, mild inflation, according to the Congressional Research Service comparison |
| Peak unemployment rate | 25.2% in 1933, according to the Congressional Research Service comparison | 10.0% in October 2009, according to the Congressional Research Service comparison |
| Unemployment at start of episode | 3.2% in 1929, according to the Congressional Research Service comparison | 5.0% in late 2007, according to the Congressional Research Service comparison |
| Employment decline | About 18% during 1929–1933 | About 6.3% in the post-2008 employment contraction |
| Bank lending, first ten quarters | About −39% after the Depression peak | About −16% after the financial-crisis peak |
| Money supply change | Nearly −30% during the Depression banking collapse | No comparable aggregate or measurement window established here |
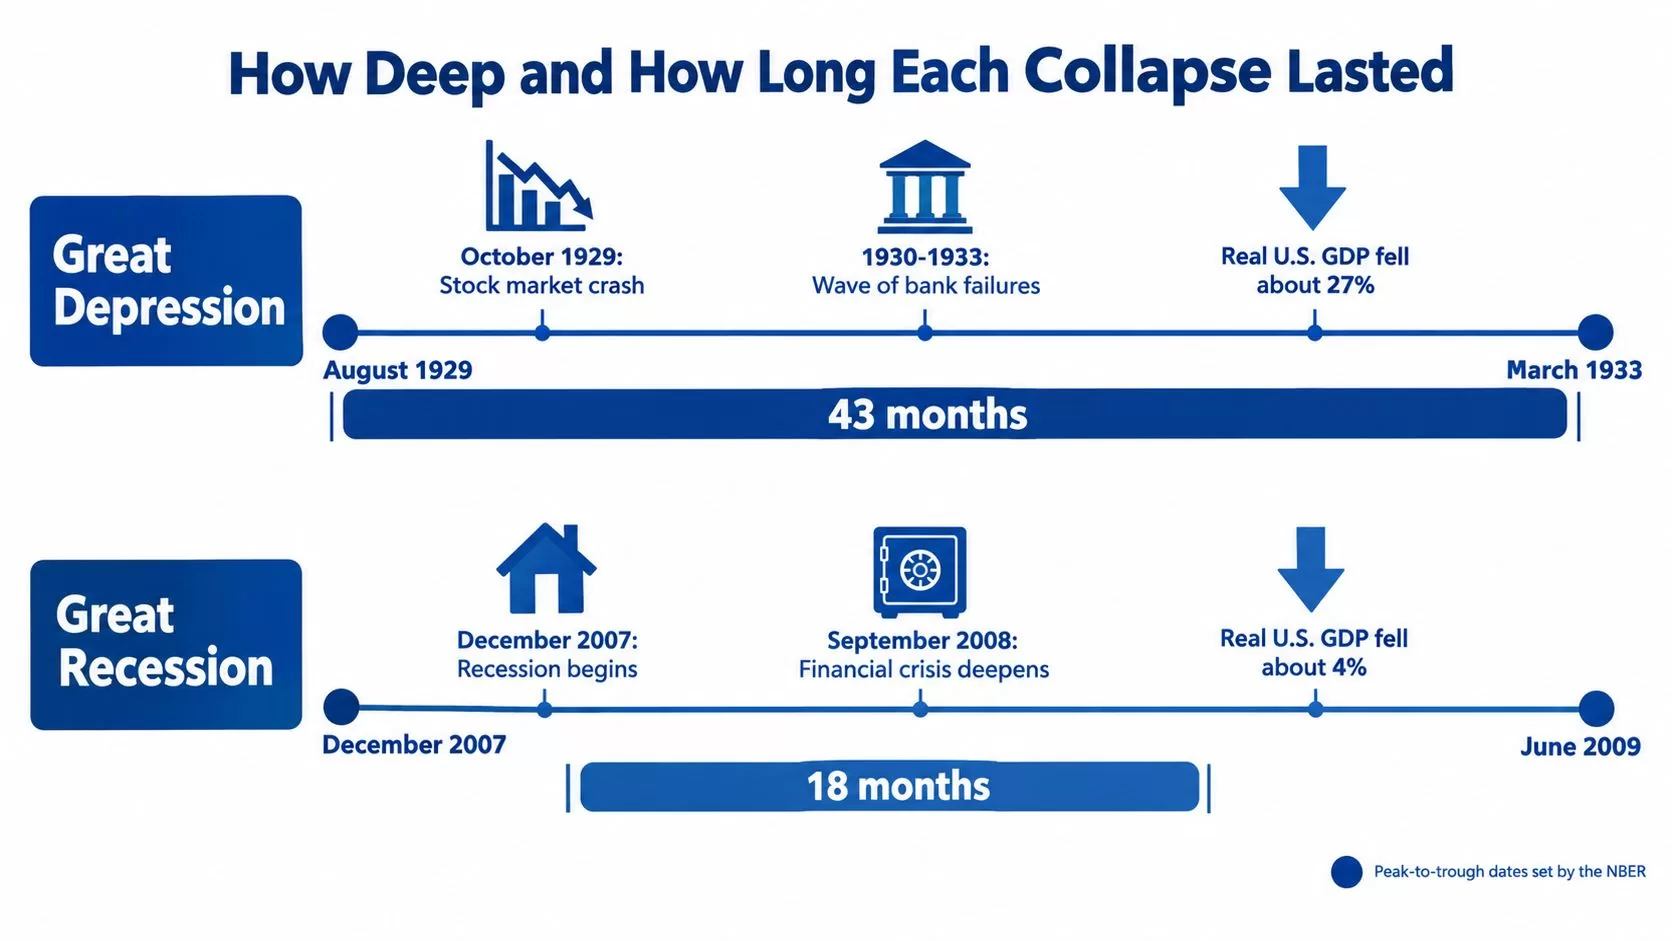
| Main contraction length | About 43 months, August 1929–March 1933 | About 18 months, December 2007–June 2009 |
| Federal funds rate | No comparable policy tool during the Depression | Near zero by December 2008 |
The comparison points to distinct stress regimes. The figures are not one synchronized snapshot: the table uses different measures and observation periods, so each comparison should be read within its stated window.
Why the direction of prices changes the interpretation
Deflation changes the burden of fixed-dollar obligations. Cash can gain purchasing power as prices fall, but debt does not automatically shrink. When wages, business revenue, or rental income also decline, servicing that debt may become harder.
The Great Recession's mild aggregate inflation presents another kind of planning problem. A retiree could face investment losses or interrupted income without the purchasing-power benefit associated with broad price declines. A withdrawal plan therefore needs to account for both portfolio value and the direction of prices.
Timing also matters. Unemployment may peak after national output stops contracting, and annual GDP estimates can differ from quarterly peak-to-trough estimates because they measure different periods. For retirement planning, these episodes differed in scale and mechanism, not merely in degree. The practical question is whether a portfolio can meet spending needs when income, credit, or asset values come under pressure.
What Triggered Each Downturn
The Depression and the 2008 crisis began with different financial vulnerabilities. During the Depression, bank failures and lost confidence disrupted depositors, lenders, and borrowers. In 2008, housing-credit losses spread through institutions that relied on short-term funding.

The Depression's banking and deflation cycle
The stock-market crash was one part of the Depression's financial breakdown. Losses fed into weaker lending, reduced spending, and falling prices, creating a cycle that could intensify economic pressure.
- Asset losses weakened confidence. Investors and businesses became less willing or able to spend.
- Bank failures disrupted finance. Depositors sought safety, while surviving lenders grew more cautious.
- Monetary contraction reinforced falling prices. As prices fell, fixed debts became harder to repay in purchasing-power terms.
- Gold-standard constraints complicated the response. Defending monetary commitments could conflict with efforts to support domestic credit.
A shopkeeper facing lower sales still had to meet a fixed mortgage payment. Cutting purchases and payroll could help keep the business open, but it also reduced income for suppliers and employees. When borrowers across the economy cut spending to conserve cash, their efforts could deepen the contraction.
The housing and funding-market chain
The later crisis grew from vulnerabilities in housing credit and financial institutions.
- Riskier mortgage lending exposed borrowers when repayment became difficult.
- Securitization spread mortgage exposure across institutions and made it harder to judge who would absorb losses.
- Heavy borrowing magnified asset declines. Thin capital cushions left lenders vulnerable to losses.
- Short-term funding dependence created run risk. After Lehman Brothers failed, lenders became increasingly reluctant to renew financing.
A lender that funds long-lived mortgage assets with borrowing it must renew frequently can face pressure even when those assets may eventually repay. If funding disappears, the lender may be unable to hold them.
Household and business retrenchment also puts pressure on public budgets. How downturns affect public finances explains this connection. For retirement planning, the mechanisms raise different questions: could income and access to credit weaken together, or could financial institutions face a sudden funding squeeze? The Depression became a banking and deflation spiral; the 2008 housing-credit crisis met a faster institutional response.
How Deep and How Long Each Collapse Lasted
The Depression's principal contraction lasted from August 1929 to March 1933, according to the NBER's business-cycle discussion. For retirement planning, the span matters because withdrawals can continue through a downturn and into an uneven recovery.
A trough isn't a completed recovery
A business-cycle trough marks the point when overall economic activity stops falling and begins expanding. It does not mean households have regained lost wealth, employers have restored every eliminated position, or lenders have returned to earlier practices.
The Depression's recovery was uneven and included a later relapse. The Great Recession's end also did not mean employment or household finances had fully recovered. National turning points and household recovery are different measures.
| Economic milestone | What it means for retirement planning |
|---|---|
| Activity peaks | Spending may reflect unusually favorable conditions |
| Output contracts | Income, asset values, and credit access may weaken together |
| Activity reaches a trough | The overall decline stops, but household losses remain |
| Recovery proceeds | Income sources and investments recover at different speeds |
A recession's official duration is therefore a poor stand-in for the period a household may face financial pressure. Losses can persist after the national contraction ends.
Why duration changes the withdrawal problem
A household with a $2,500 monthly gap between essential spending and dependable pension and benefit income must fund that shortfall from other resources. If investments have fallen, selling assets to cover routine expenses can make the withdrawal plan more difficult.
For example, a household facing that gap from August 1929 to March 1933 would need to fund withdrawals throughout a prolonged contraction. A shorter downturn would still create an immediate cash need, but the household might rely on reserves for less time. The difference is not just the initial decline. It is how long spending depends on assets while values and income remain under pressure.
A brief disruption may be manageable through an existing reserve and postponed discretionary purchases. Persistent weakness can force harder choices about spending, rebalancing, debt, and which assets to sell.
A retirement plan needs an assumption about the length of financial pressure, not only the size of an initial market decline.
Depth and duration are separate stress tests. A steep, short-lived shock can create an urgent liquidity problem; a milder but longer one can steadily reduce spending flexibility. The practical question is how long a household can meet obligations without selling assets at unfavorable prices.
Policy Tools and Why 2008 Stopped Short of a Depression
The two downturns were different stress regimes. In the Depression, banking panics repeatedly disrupted credit and deposit protection was not yet in place. By 2008, policymakers had tools to support funding, protect deposits, shore up institutions, and support household income. Those distinctions matter to retirement planning because they affect whether pressure reaches a portfolio through falling asset prices, tighter credit, or a prolonged interruption in income.
| Policy tool | Great Depression (1930s) | 2008–09 crisis |
|---|---|---|
| Short-term interest rates | Limited easing during banking panics | Federal funds rate reduced to essentially zero by December 2008 |
| Lender of last resort | Emergency support failed to stop repeated banking panics | Emergency lending facilities provided funding to financial institutions |
| Deposit insurance | No federal insurance until 1933 | Deposit protection already in place |
| Bond or Treasury purchases | About 2% of GDP in 1932, as reported by the NBER's comparison of Federal Reserve strategies | November 2008–March 2009 purchases were broadly comparable relative to GDP |
| Fiscal stabilizers and stimulus | Limited federal spending response | Automatic stabilizers and enacted stimulus |
| Unemployment insurance | Essentially no federal system during the initial collapse | State and federal benefits available and expanded |
| Estimated output loss without intervention | No comparable estimate established here | A modeled counterfactual in the NBER working paper comparing the crises estimates a loss of about 12%, versus about 4% actual |
The Federal Reserve Bank of Chicago's annual report describes the near-zero policy rate by December 2008 and the emergency lending facilities used during the crisis. Rate cuts reduced borrowing costs, while lending facilities provided funding when private markets were strained. Together, these measures addressed both the cost and availability of credit.
The tools that interrupted the banking spiral
Deposit protection reduced insured depositors' incentive to withdraw funds for fear that others would withdraw first. It did not eliminate investment losses or make every financial product safe. For a retiree, it is a reminder to distinguish insured deposits from market investments when assessing available cash.
Lender-of-last-resort access helped institutions obtain funding when private lenders were unwilling to provide it. That could reduce pressure to sell assets quickly, but liquidity support could not repair an institution whose losses exceeded its capital.
Recapitalization and coordinated intervention addressed whether institutions could absorb losses and continue lending. Fiscal stabilizers also supported household income as private demand weakened. These mechanisms worked through different channels, so an allocation review should not treat all forms of policy support as interchangeable.
The NBER working paper reports that bank lending fell about 39% during the Depression's first ten quarters, compared with roughly 16% after the later peak. The comparison does not isolate the effect of any single intervention. It does show how a sharp contraction in credit can make a financial shock more disruptive for households and businesses.
What the counterfactual can and can't establish
The modeled no-intervention scenario estimates a much larger output loss than the one that occurred. It is a counterfactual, not an observed alternative history. The estimate illustrates how financial and fiscal support might limit damage; it does not establish that future policymakers will act as quickly or effectively.
Planning implication: Policy can reduce systemic damage without preventing losses in a particular retirement account.
A useful allocation review should consider both an intervention-supported recovery and a delayed-policy scenario. Ask how long accessible cash could cover planned withdrawals, whether borrowing would remain available, and whether the plan depends on selling investments before market conditions improve. These questions connect the historical difference in policy capacity to the household's actual exposure.
Unemployment and Household Pressure on Retirees
The NBER analysis of employment and recovery describes Depression unemployment rising from about 3% to 24%–25% and remaining above 15% for roughly a decade. The historical comparison establishes much greater sustained labor-market distress, but it doesn't measure every household's retirement risk.
Historical unemployment measures also require caution because headline unemployment doesn't capture all unwanted part-time work. For a near-retiree, the relevant exposure includes reduced hours, difficulty finding comparable employment, and the possibility of leaving work earlier than planned.
Which crisis was more dangerous for a household drawing retirement income?
The answer depends on exposure and timing, not the label attached to the downturn. A household already receiving dependable income faces a different problem from one relying on continued employment or investment sales.
Sequence-of-returns risk arises when withdrawals occur during unfavorable investment returns, particularly early in retirement. Selling assets to fund spending leaves fewer assets participating in any subsequent recovery, so an eventual rebound doesn't necessarily restore the original plan.
A household approaching retirement should examine:
- The spending gap. Essential expenses minus dependable income identify the amount that investments must provide.
- The reserve period. As a hypothetical planning exercise, compare a cash reserve covering one year of withdrawals with one covering two years, rather than assuming either is universally appropriate.
- The employment assumption. A plan that works only if a household member keeps earning deserves a separate involuntary-retirement test.
- Debt structure. Fixed payments create different pressures from borrowing whose interest cost can reset.
The discussion of why working longer can be a weak retirement fallback is relevant when future wages are the plan's main contingency.
Policy capacity isn't household insurance
A large central-bank balance sheet shouldn't be treated as a promise that a household's investments or income will recover promptly. Its size alone doesn't establish how quickly authorities can address a particular shock.
The practical task is to identify the household's weakest dependency. That might be continued employment, an anticipated home sale, concentrated equities, or borrowing that becomes expensive at the wrong time.
A household-specific analysis can therefore reach a different conclusion from the national ranking of crises. The smaller macroeconomic contraction may still coincide with a household's least flexible financial moment.
Stress-Testing Your Portfolio for Each Scenario
A stress test should specify the type of disruption before assigning investment returns. Applying the same generic crash assumption to every risk can conceal the difference between purchasing-power losses, market losses, and temporary inability to access funds.
Downturn Scenarios for Retirement Portfolio Stress Tests
| Scenario | Output loss assumption | Unemployment assumption | Key portfolio question |
|---|---|---|---|
| Deflationary depression | Severe, prolonged contraction | Widespread and persistent joblessness | Can cash and suitable bonds fund withdrawals while prices fall? |
| Severe postwar recession | Smaller than a Depression-scale collapse | Sharp increase followed by an uneven recovery | How much equity decline can occur early in withdrawals? |
| Stagflation, inflation with slow growth | Weak or contracting output specified by the model | Set independently from the inflation assumption | How do fixed-income and metals holdings perform as prices rise? |
| Bank stress or liquidity squeeze | No output decline required for the initial access problem | No unemployment increase required initially | Are reserves accessible outside stressed institutions? |
These are scenario descriptions, not forecasts. Stagflation and bank stress shouldn't receive invented historical benchmarks merely to make the table look complete.
A practical testing procedure
Establish the withdrawal requirement. Record the current withdrawal rate and annual dollar amount needed after dependable income. Separate essential spending from purchases that can be postponed.
Count the months of cash and short-term reserves available, including where they're held. Identify any dependence on an institution whose disruption could interrupt access.
Measure equity concentration. Model a hypothetical decline during the first three withdrawal years, including what must be sold and what can remain invested.
Test fixed-income purchasing power under the stagflation scenario. A stable nominal account value doesn't necessarily preserve the spending it can support.
Define the metals allocation's job. Specify whether it is intended for diversification, inflation sensitivity, or another purpose, then include sale proceeds after fees and liquidity constraints.
Have a licensed financial advisor rerun the plan before allocations change. Compare spending adjustments and reserve changes alongside investment substitutions.
For additional withdrawal-focused context, Wealth Collective's strategies to reduce retirement withdrawal risk complement this scenario approach. A separate comparison of gold and the S&P 500 can help frame the distinction between holding a diversifier and expecting it to replace productive assets.
The useful result is a decision rule: which spending changes, asset sales, or rebalancing actions would occur under each scenario.
Historical performance isn't a forecast. A test is most valuable when it reveals a manageable weakness before a household must act under pressure.
Common Questions About the 2008 Recession and the Great Depression
Is there an official definition of a depression?
No official threshold marks the point when a recession becomes a depression. The NBER identifies economic peaks and troughs, while “depression” is an informal label for an unusually deep, prolonged collapse. For retirement planning, the label matters less than the assumptions used to test prices, income, credit, and spending.
Those assumptions should reflect different stress regimes. A crisis centered on financial institutions raises questions about access to cash and credit; a prolonged economic collapse raises questions about whether withdrawals remain sustainable over time.
Could the financial crisis have turned into a depression?
Yes, but the outcome cannot be established by the label alone. A counterfactual has a clear limit: the 2008 episode did not reproduce the Great Depression's full duration and depth, so it cannot show exactly how a prolonged collapse would have affected households or portfolios. The planning question is whether a retirement plan could withstand a longer disruption than the one experienced.
Does this comparison mean gold should be bought now?
No. A historical comparison does not settle a current allocation decision. Evaluate a proposed purchase against existing investments, withdrawal needs, costs, and tolerance for losses.
A metals allocation may reduce one exposure while adding concentration or sale-timing concerns. Compare how the revised portfolio would support withdrawals under each stress regime, rather than treating resemblance to a past crisis as a reason to buy.
Historical labels can frame that analysis, but the appropriate allocation depends on household finances and tax circumstances.This content is educational and isn't personalized financial advice.
Deciding Whether Precious Metals Fit Your Plan
Precious metals can be evaluated as a diversification sleeve, not a guaranteed hedge. The defensible case rests on their role within the entire retirement plan, including the income sources and liquid assets that fund spending.
The planning image reflects that broader decision: metals belong alongside a portfolio and a spending plan, not outside them.

Different households may reach different conclusions
Heavy equity exposure and little cash. A near-retiree may benefit from modeling a metals allocation, but the analysis should also test whether a spending reserve addresses the more immediate weakness. Adding an asset doesn't automatically solve a cash-flow shortfall.
Substantial bonds and cash already held. The incremental role of metals may be smaller. The question becomes whether the proposed allocation adds a useful exposure after accounting for the portfolio's existing defensive assets.
Limited retirement savings. Account costs and provider minimums may outweigh the benefits of added complexity. Keeping adequate accessible resources may matter more than introducing another account structure.
A careful discussion of gold as an inflation hedge should distinguish a possible diversification role from a reliable match for household expenses. Inflation protection, crisis protection, and immediate liquidity aren't interchangeable objectives.
Evaluate the account as carefully as the metal
For a precious metals IRA, the review should cover custodial arrangements, storage, transaction costs, taxation, and concentration. Written terms should explain how purchases and sales are priced, how assets are held, and how distributions are handled.
IRA-eligible gold and silver must satisfy applicable IRS requirements, including relevant purity standards and custodial arrangements. Current requirements and product-specific exceptions should be verified before acting, and individual circumstances can affect the tax consequences.
Provider comparisons should examine fees, minimums, storage options, and reputation rather than assume a single company suits every saver. A favorable description of the metal doesn't establish that the account holding it is economical or appropriate.
The central lesson is to match the allocation to the risk being addressed. A sound decision begins with withdrawal needs and scenario results, then evaluates whether metals improve the plan after their costs and limitations are included.
This is not financial advice. Consult a licensed financial advisor, CPA, or tax professional before making investment decisions.
Gold IRA Association offers educational guides and company comparisons covering precious metals IRA fees, minimums, storage, and account mechanics. After reviewing the downturn scenarios and confirming household withdrawal needs, visit Gold IRA Association to compare providers against those specific planning requirements.