



A saver nearing retirement may see gold quoted near $3,400 per ounce and assume that an earlier purchase has multiplied in value. That conclusion can be too optimistic because the dollar itself has lost purchasing power. The price of gold adjusted for inflation answers a more useful question: how much purchasing power did the investment gain after accounting for changing prices?
Why a Nominal Gold Price Can Mislead Retirement Savers
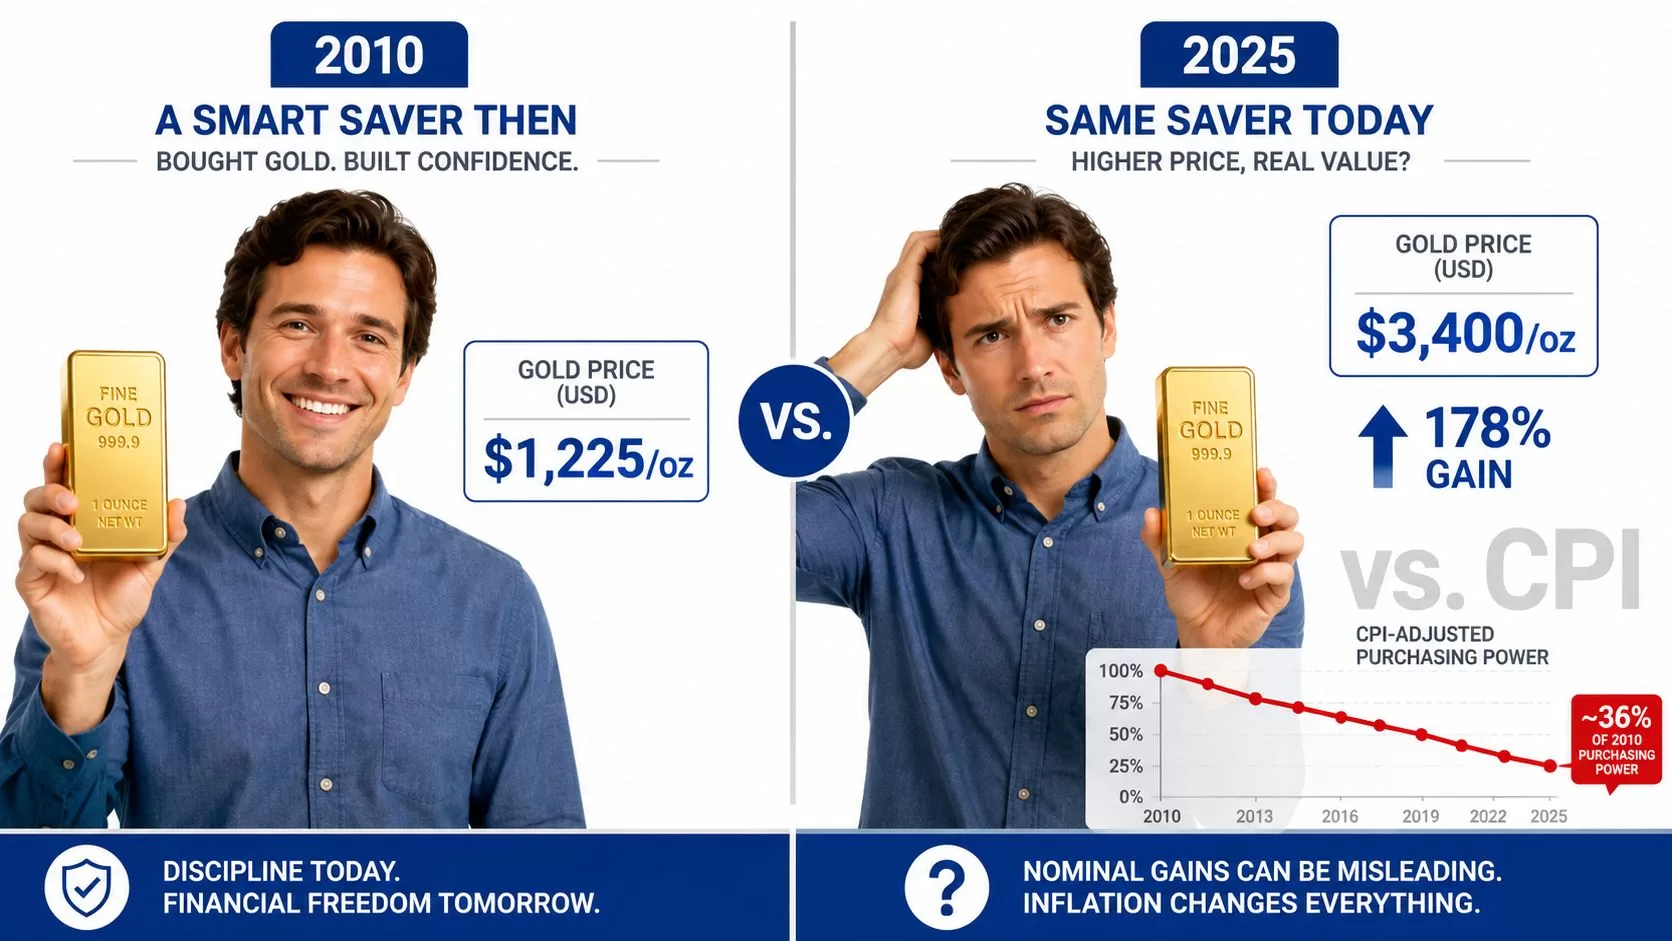
Suppose a saver bought gold in 2010 at roughly $1,225 per ounce and later saw a 2025 quote near $3,400. The nominal calculation suggests a gain of about 178%, but that comparison treats a 2010 dollar as equal to a 2025 dollar. Consumer prices rose substantially over the same period, so the saver's real gain is smaller than the headline quote implies.
The practical issue is simple. A retiree doesn't spend nominal percentages. Retirement withdrawals pay for groceries, housing, insurance, healthcare, and other goods whose prices also change. If gold rises while the dollar buys less, part of the apparent increase merely compensates for inflation rather than creating additional purchasing power.
The three retirement mistakes
A nominal chart can create three problems:
- Benchmarking error: A saver may compare gold's unadjusted increase with stock or bond returns measured over a different purchasing-power base. That can make one asset appear stronger just because the comparison uses inconsistent dollars.
- Income-planning error: A retirement projection may assume the full nominal gain is available to fund future spending. Inflation-adjusted values provide a more realistic reference for what the proceeds may buy.
- Allocation error: A large nominal rise can encourage a retiree to add too much gold after a strong run, even though the inflation-adjusted price may already be far above long-run benchmarks.
Gold's historic record makes this distinction important. In 1980, the nominal annual average reached about $615 per troy ounce, while an inflation-adjusted dataset places that value near $3,400 per ounce in 2026 dollars. The historical comparison of gold and the S&P 500 can help readers evaluate why nominal price growth shouldn't be treated as a complete investment return.
The better habit is to ask two questions separately: what was the quoted price, and what would that price represent in the purchasing power of the chosen comparison year? That adjustment doesn't predict gold's next move, but it gives a 60-year-old a more defensible basis for judging performance, withdrawals, and portfolio size.
What “Price of Gold Adjusted for Inflation” Actually Means
An inflation-adjusted gold price, also called a real gold price, converts an earlier quote into the purchasing power of a selected base year. The calculation doesn't change what an ounce originally cost. It changes the dollar language used to describe that cost.
There are two common ways to read the result:
- Historical price in today's dollars: What would the amount paid for an ounce in an earlier year represent in the dollars of the base year?
- Current quote in older dollars: What would today's ounce price look like if expressed in the purchasing power of a past year?
For example, a chart may express the 1980 gold price in 2025 dollars. That doesn't mean gold traded at that modern figure in 1980. It means the chart has adjusted the earlier nominal amount so readers can compare purchasing power across time.
The formula in plain English
Using standard notation:
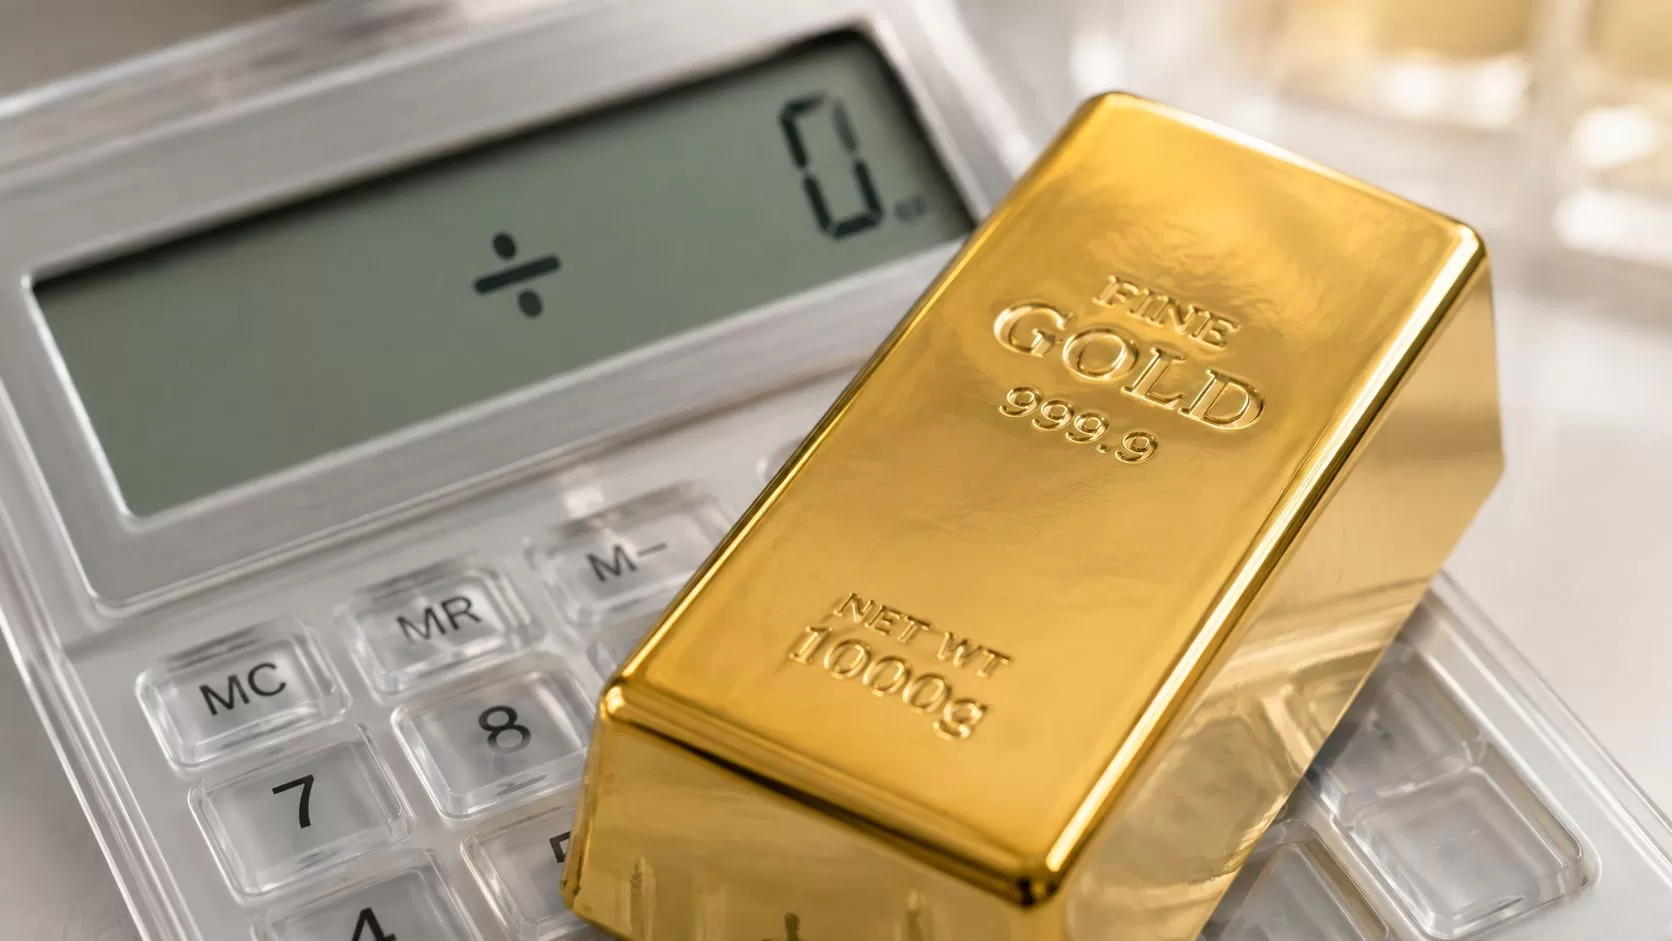
P_real = P_nominal × (CPI_base ÷ CPI_t)
Here, P_nominal is the historical gold price, CPI_t is the consumer-price index in the historical year, and CPI_base is the index for the year chosen as the comparison point. The output, P_real, is the historical price expressed in constant base-year dollars.
The choice of inflation measure matters. CPI-U covers urban consumers and is commonly used for retail purchasing-power comparisons. CPI-W covers urban wage earners and clerical workers. PCE measures a broader pattern of personal-consumption spending, while the GDP deflator covers prices across domestically produced goods and services. Two charts can therefore differ without either being automatically wrong.
Methodology also changes the historical picture. One dataset begins around 1915, another begins in 1971, and long-run averages vary depending on the starting year and CPI vintage. Historical gold-price data and chart methodology illustrate why the chart's date range should be checked before a reader treats a “record” or average as universal.
In broad terms, a real-price chart can show gold weakening during a long disinflationary bear market even when nominal prices move unevenly. It can also show a powerful real advance during periods when investors accept lower real returns elsewhere. The adjustment is a measuring tool, not a forecast.
How the Inflation-Adjusted Gold Price Is Calculated Step by Step
A reader can reproduce a CPI adjustment with a historical gold-price series and annual CPI-U averages. The process is more useful than relying on a chart whose base year or data frequency isn't clear.
A four-step calculation
Step 1, choose the gold price. Use an annual average rather than a single daily quote when comparing full years. A worked example starts with approximately $1,223 per ounce in 2010.
Step 2, collect the CPI values. The example uses a CPI-U annual average of 218.056 for 2010 and 313.689 for 2024.
Step 3, apply the formula. The calculation is:
$1,223 × (313.689 ÷ 218.056) = roughly $1,760 in 2024 dollars
That result says the 2010 purchase price had purchasing power similar to about $1,760 in 2024 dollars. It doesn't say the gold was worth only that amount in 2024. It creates a constant-dollar reference for comparing the old purchase price with a later market quote.
Step 4, perform a reasonableness check. Compare the result with a pre-adjusted real-price series and confirm that the selected price frequency, CPI measure, and base year match. A chart can look precise while mixing monthly gold prices with annual inflation data.

A second historical check
The 1980 annual average of about $615 per ounce converts to roughly $2,451 in 2025 dollars in one historical dataset, while another comparison places the famous real peak in the low-to-mid $3,000s, depending on whether it uses an annual average, monthly average, or intrayear high. That difference is a reminder that “the 1980 peak” isn't one universal number.
Readers can use three general calculation paths:
- Build the series manually: Pair annual gold prices with CPI-U values and apply the formula in a spreadsheet.
- Use a pre-deflated series: Review a historical dataset that already expresses gold in constant dollars, then verify its base year and source methodology.
- Use a commodity table: Compare a constant-dollar commodity series with the gold-price series, while checking whether the table uses annual averages or spot observations.
A simple spreadsheet needs four columns: Year, Nominal Price, CPI, and Real Price in 2024 Dollars. Free inflation calculators can provide a quick check, but they shouldn't replace examining the underlying CPI series when a retirement decision depends on the result.
Historical Inflation-Adjusted Gold Prices From 1971 to 2026
Gold's modern real-price history begins with a low purchasing-power base after the fixed-price era ended. Annual average gold was about $35 per ounce in 1971, while one inflation-adjusted series places the 1971 value near $326 in 2025 dollars. By 2024, the nominal annual average had reached about $2,386, and the same dataset showed a real value near $2,451 in 2025 dollars. The 2025 nominal and real values converge near $3,432 because the series is rebased to 2025 dollars. These figures are documented in the inflation-adjusted historical gold-price series.
The 1980 episode remains the critical reference point. The nominal annual average was about $615, and another widely cited comparison places the inflation-adjusted peak near $3,500. The high wasn't challenged for roughly 45 years, until gold briefly reached about $3,500 in nominal terms in April 2025. A separate analysis reports that the 2025 annual average of $3,432 became the highest annual average in a 56-year series, exceeding the inflation-adjusted 1980 annual average under that methodology. A 2026 analysis of the 1980 real-price record explains why monthly, annual, and spot-price comparisons can produce different record dates.
A reference table
| Year | Nominal Price (USD/oz) | CPI-U Value | Real Price (2024 USD/oz) | Macro Note |
|---|---|---|---|---|
| 1971 | About $35 | Not shown in the verified series | About $326 in 2025 dollars | End of the fixed-price era |
| 1980 | About $615 annual average | Not shown in the verified series | About $2,451 in 2025 dollars under one annual-average method | Historic real-price peak |
| 2024 | About $2,386 annual average | Not shown in the verified series | About $2,451 in 2025 dollars | Elevated nominal and real valuation |
| 2025 | About $3,432 annual average | Base-year convergence | About $3,432 in 2025 dollars | Highest real annual average in one long series |
| 2026 | Around $4,365 on September 2, 2026 | Not shown in the verified series | Current-dollar quote | Recent market level |
The table isn't a complete yearly history. It is a set of anchors for checking whether a chart uses nominal prices, annual averages, or a particular CPI base. A reader considering a gold trading forecast 2026 should treat forecasts as conditional scenarios, not as guaranteed outcomes.
For retirement planning, the key pattern is that gold has moved through long stretches below and above its inflation-adjusted historical benchmarks. A long-run series reports averages of about $883.51 since 1913, $974.11 since 1933, and $1,397.44 since 1980, all in 2025 dollars, as shown in inflation-adjusted annual-average gold data. The appropriate benchmark depends on the period selected.
The return-on-gold discussion is most useful when paired with this context. A nominal return can look impressive while the result sits closer to a long-run average, or it can look ordinary while protecting purchasing power during a difficult monetary regime.
Why Real Interest Rates Move Gold More Than CPI Does
Inflation matters, but it isn't the only force affecting gold. Real interest rates measure the return on cash or bonds after adjusting for inflation. A simplified version is:
Real rate = nominal interest rate minus inflation
If inflation is 4% and a short-term policy rate is 5%, the simplified real rate is positive. If inflation is 5% and the policy rate is 2%, the simplified real rate is negative. The second environment can make a non-yielding asset such as gold more attractive relative to cash or bonds, although market prices also reflect expectations, currency movements, risk appetite, and supply and demand.
The opportunity-cost explanation is especially important for retirees. When safe assets offer a meaningful inflation-adjusted yield, holding gold means giving up income. When real yields fall or turn negative, that sacrifice becomes smaller. Gold can then receive support even if the inflation rate itself isn't accelerating.
Practical rule: Track the real return available from the portfolio's safer assets, not just the grocery-price index.
Research summarized in the verified data reports a strong relationship between real yields and real gold prices. All else equal, a 100-basis-point increase in 10-year real yields has historically been associated with an 18% decline in gold's inflation-adjusted price, according to the cited PIMCO analysis of the Chicago Fed relationship. This is an association, not a trading rule or a promise that every rate move will produce the same result. The relationship between gold and real yields should therefore be treated as a portfolio-risk indicator rather than a standalone timing signal.
A retiree reviewing a bond allocation can ask:
- What is the current real yield? Compare the stated yield with a reasonable inflation measure.
- What does the bond allocation provide? Income and stability may matter more than a gold chart's recent direction.
- Would a gold purchase diversify risk? Gold doesn't replace emergency cash, a bond ladder, or a sustainable withdrawal plan.
Gold's role becomes clearer when CPI and real rates are viewed together. Inflation-adjusted performance explains purchasing power. Real rates help explain why the market may value gold above or below that historical reference.
Limits of the CPI-Adjusted Gold Price and Common Misreadings
CPI is useful, but it isn't a perfectly neutral ruler. CPI-U reflects a broad urban-consumer basket and includes methods such as owner-equivalent rent. Substitution decisions, housing treatment, geographic coverage, and the selected CPI vintage can all affect the final adjustment. CPI-W and broader chain-weighted measures can produce different results.
That creates several common mistakes:
- Mistaking the nominal 1980 high for the inflation-adjusted high: The nominal spike near $850 per ounce is not the same as its inflation-adjusted value. Depending on the CPI basis, the inflation-adjusted benchmark falls in the low-to-mid $3,000s, not at $850.
- Calling 2011 the definitive inflation-adjusted-price bubble: A historical comparison places the 1980 inflation-adjusted peak above the 2011 level under the relevant inflation adjustment. The label depends on the measurement period and base year.
- Treating every current nominal record as proof of a bubble: A nominal high may be less extreme after inflation adjustment. Conversely, recent gold prices can also exceed earlier inflation-adjusted benchmarks, so inflation adjustment doesn't automatically make present valuations look cheap.
Charts also smooth out volatility. An annual average can conceal sharp movements within the year, while a monthly average can tell a different story from an intraday high. International buyers face another complication because a U.S.-dollar chart doesn't measure purchasing power in every local currency.
Before drawing a portfolio conclusion, a reader should ask:
- Which CPI series and base year does the chart use?
- Does the gold figure represent a daily quote, monthly average, or annual average?
- Is the comparison meant to measure purchasing power, investment return, or opportunity cost?
A real-price chart answers only the question its construction permits. It doesn't include storage costs, dealer spreads, taxes, account fees, or the income forgone by holding a non-yielding asset. Those details matter when a retiree turns historical analysis into a purchase decision.
What Inflation-Adjusted Gold Tells You About Gold IRA Allocation
Inflation-adjusted history supports a strategic, diversified role for gold, not an automatic decision to move a large share of retirement savings into it. The long record includes powerful advances, extended declines, and periods when inflation alone failed to explain the price. That pattern is difficult to reconcile with a claim that gold will always protect a portfolio.
A commonly discussed allocation range is 5% to 15%, but the verified data does not establish a universally suitable percentage. A retiree's decision should instead reflect spending needs, liquidity, other inflation-sensitive assets, tolerance for drawdowns, tax circumstances, and the time horizon for withdrawals. Someone who needs the money soon may value liquidity and income more heavily than someone with a longer horizon and other reliable resources.
Questions for a Gold IRA decision
Purpose comes first. Gold may serve as a diversifier or a hedge against certain monetary and market risks. It isn't a substitute for an emergency reserve, guaranteed income, or a complete retirement plan. The evidence on real rates also suggests that the opportunity cost of non-yielding gold deserves as much attention as CPI protection. The role of gold as an inflation hedge should be evaluated with both strengths and limitations in view.
Account structure matters. A Gold IRA generally involves a self-directed retirement account, a qualified custodian, and approved physical metals held through an authorized storage arrangement. The account owner typically can't treat personally stored bullion as if it were properly held retirement-account property. IRS eligibility, purity, custody, distributions, and tax rules should be verified for the specific account and transaction.
Costs affect the result. Setup charges, custodian fees, storage costs, dealer spreads, and selling expenses reduce what the account ultimately provides. A price chart shows the metal's market value, not the investor's net return.
A practical checklist includes:
- Define the job: Decide whether gold is intended for diversification, inflation concerns, or another clearly stated purpose.
- Review liquidity: Confirm how withdrawals would work and whether selling physical metal could involve delays or spreads.
- Check concentration: Measure the proposed gold exposure against the full retirement portfolio, not just one IRA.
- Verify compliance: Confirm eligible products, custody, storage, and tax treatment with qualified professionals.
- Set a review rule: Reassess the allocation periodically instead of chasing a recent nominal high.
This is not financial advice. Consult a licensed financial advisor, CPA, or tax professional before making investment decisions.
Gold IRA Association offers educational guides, rollover information, provider comparisons, and practical checklists for readers evaluating precious metals in retirement accounts. Visit Gold IRA Association to compare Gold IRA resources and take the next step with a clearer understanding of inflation-adjusted gold, account structure, and diversification.