



The silver-to-platinum ratio compares the benchmark price of an ounce of platinum with that of an ounce of silver. World Bank annual averages put the reading near 43 from 2020 to 2023, while a 2024 reading near 30 was lower than that recent range, according to the World Bank Pink Sheet.
A reading is a relative-price screen, not a verdict on which metal to buy. The same ratio can reflect platinum scarcity, a near-term surplus, or stronger silver prices. Retirement savers can use it to frame questions, then weigh costs, eligibility, and portfolio fit before making an investment decision.
How the Silver to Platinum Ratio Is Calculated
Platinum price ÷ silver price = ounces of silver equal in benchmark value to an ounce of platinum. Both prices must use the same currency and the same weight unit.
The name can cause confusion. Some publishers call this the platinum-to-silver ratio, which follows the order of the division. Others use silver to platinum ratio when discussing how many silver ounces equal a platinum ounce. Checking the formula matters more than the label: dividing silver by platinum produces the reciprocal, with the direction of every interpretation reversed.
A worked example using annual averages
For 2020, platinum averaged $883 per ounce and silver averaged $20.50, producing approximately 43.1 ounces of silver per ounce of platinum, using the annual commodity averages associated with the World Bank Pink Sheet.
The arithmetic is straightforward: divide the platinum average by the silver average. The resulting annual comparisons are shown below, with prices in U.S. dollars per troy ounce.
World Bank annual silver-to-platinum readings, 2020–2023
| Year | Platinum average | Silver average | Ratio |
|---|---|---|---|
| 2020 | $883 | $20.50 | 43.1 |
| 2021 | $1,091 | $25.20 | 43.3 |
| 2022 | $962 | $21.80 | 44.1 |
| 2023 | $994 | $23.40 | 42.5 |
Across these observations, a band around 40 to 45 meant that a platinum ounce had roughly the benchmark value of forty to forty-five silver ounces. The movement from the earlier annual reading to the next was an increase when the calculated result became larger, regardless of whether either metal's dollar price fell.
These are ratios of annual average prices, not annual averages of daily ratios. Those calculations needn't produce identical results because the daily relationship changes throughout the year.
What the calculation leaves out
A benchmark comparison isn't a dealer's executable exchange offer. A physical holder selling platinum and purchasing silver would face a selling price and a buying price, along with any applicable transaction charges.
That distinction prevents a common mistake: interpreting a benchmark ratio as the exact quantity of bullion an investor could receive in a swap. Retail premiums and bid-ask spreads can change the outcome.
Practical rule: Keep the metal, currency, weight unit, and observation period consistent before doing the division.
The annual series shown ends in 2023. A comparison involving 2024 or 2025 annual performance needs the corresponding current World Bank annual averages, while a present-day decision needs current daily benchmark prices.
There's no permanent conversion rate between these metals. Their separate supply conditions, industrial buyers, investment flows, and economic exposures mean a past neighborhood isn't a lasting definition of fair value.
Which Benchmark Prices Make the Ratio Comparable
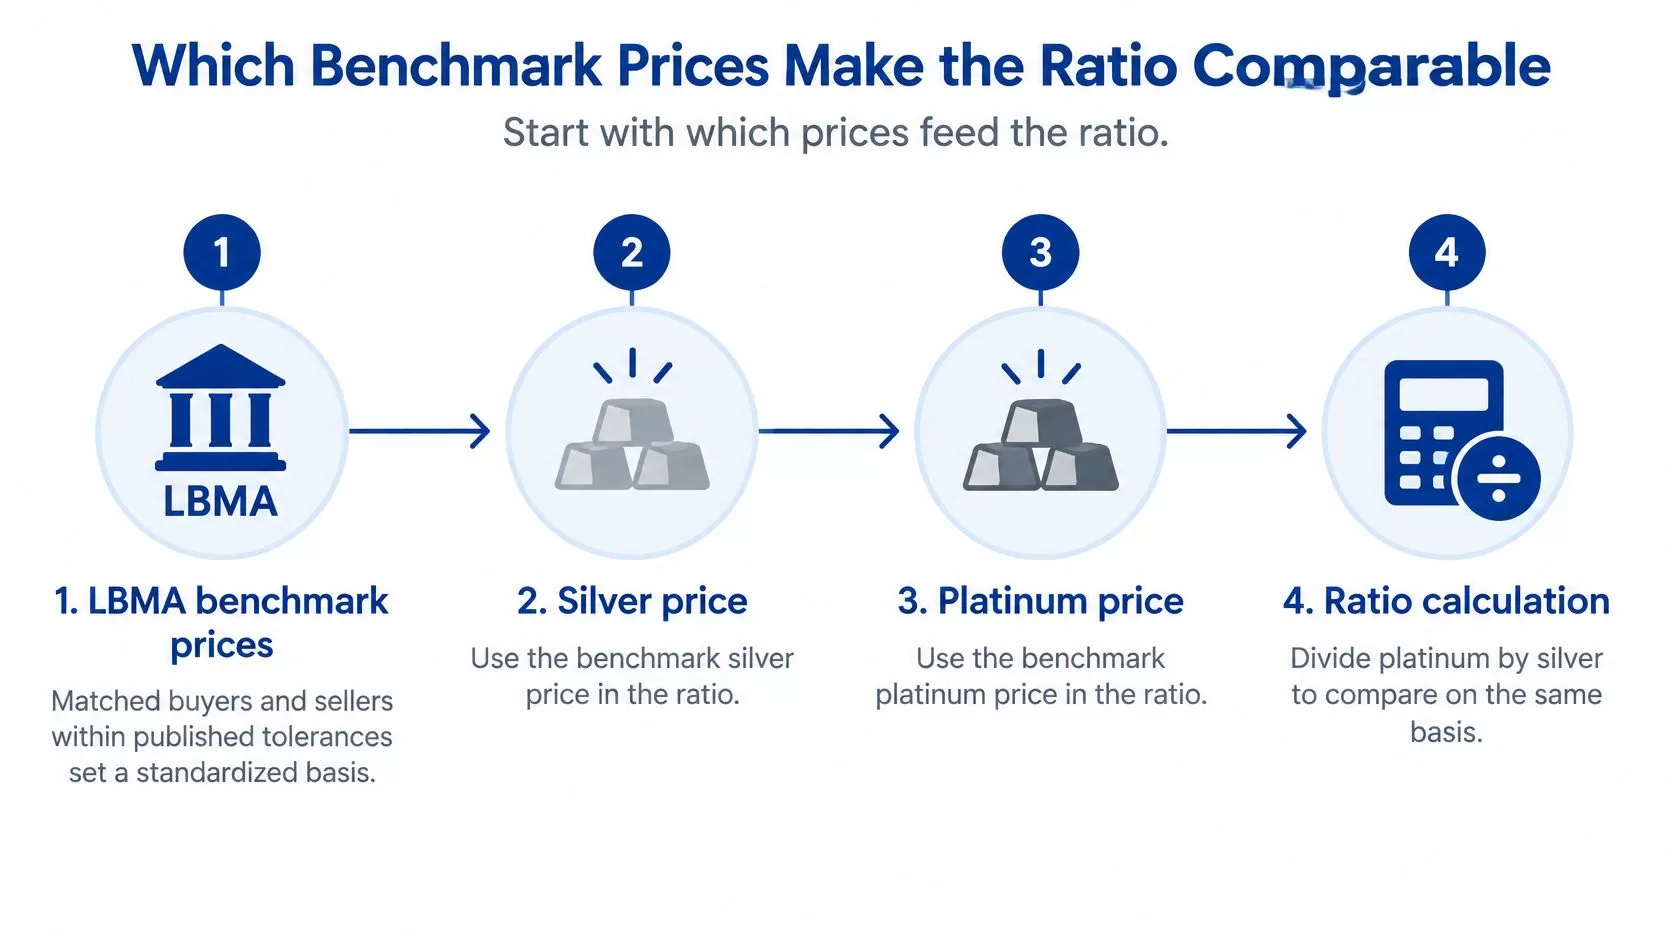
The prices entering the calculation determine whether the comparison is useful. A standardized benchmark provides a more consistent starting point than combining a dealer's silver selling price with another dealer's platinum buying price.
The same care applies to timing. A reader comparing an intraday platinum quote with an older silver closing price may be measuring a timing difference rather than a meaningful relative-price change.
The benchmark process can be organized into a simple comparison workflow.
Keep the price basis consistent
Recognized benchmark processes match buyers and sellers under published procedures. For a practical comparison, the reader should record:
- Price type: Benchmark, spot indication, retail ask, or dealer bid.
- Observation time: A matching date and a clearly identified pricing session.
- Units: The same currency and troy-ounce basis for both metals.
The distinction between a troy ounce and a regular ounce matters because ordinary household weight measurements aren't interchangeable with bullion pricing units. A reliable calculation starts with comparable inputs, not just apparently comparable dollar amounts.
A historical low isn't a destination
According to Auronum's platinum-to-silver series, the ratio reached 30.11 on October 18, 2024, its lowest reading in the publisher's 1985–2024 dataset. That finding applies to that dataset, not to every possible historical series.
The Economic Times described a reading near 30 in 2024 against an older reference near 150. Separately, CME Group stated in 2025 that platinum had underperformed silver on this measure since 2003.
Those comparisons establish context, not an expected trading range. An older reference point doesn't establish when, whether, or how a relationship will recur.
What a Rising or Falling Ratio Actually Means
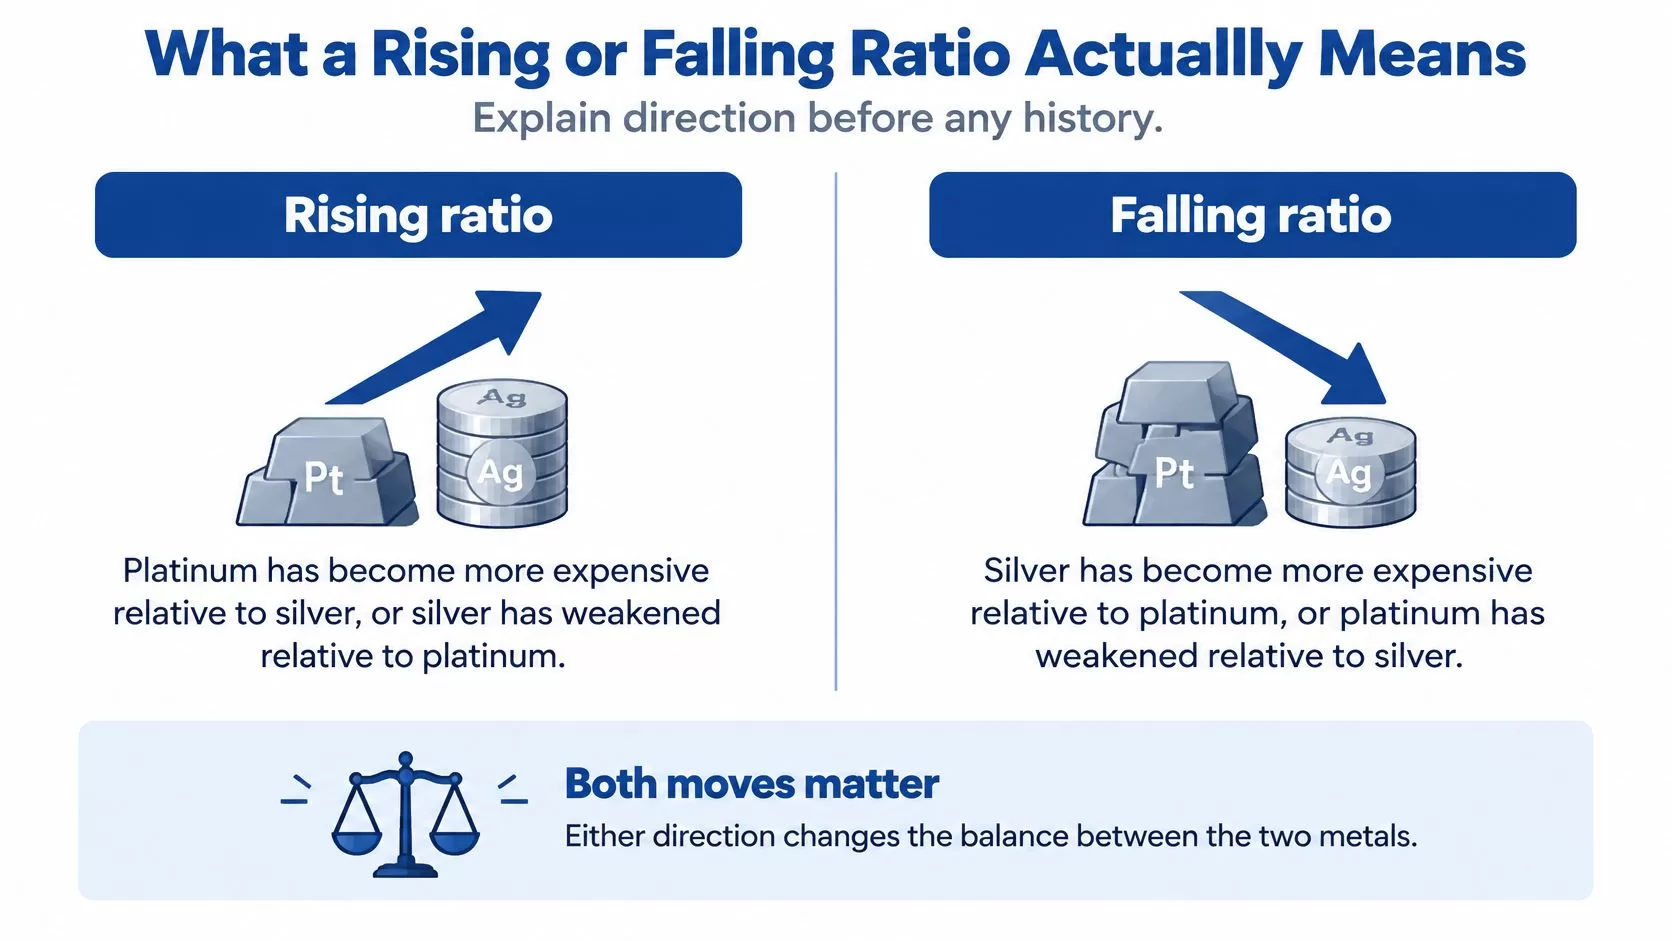
A rising ratio means platinum has become more expensive relative to silver, or silver has weakened relative to platinum. A falling ratio means silver has become more expensive relative to platinum, or platinum has weakened relative to silver.
Neither direction identifies an absolute investment return. Both metals can rise while the ratio falls if silver rises faster; both can fall while the ratio rises if silver falls faster.
The visual distinction is simple, but it's important to keep the division order unchanged.
Separate relative performance from investment performance
The World Bank's precious-metals commentary reported precious-metal prices up about 20% year over year in 2024, while silver reached a 12-year high in October and platinum remained high but weakened during the third quarter. The category-wide increase therefore didn't mean each metal delivered the same gain.
Consider a saver holding both metals. If silver appreciates faster, the account's silver share can grow even without a purchase. The falling ratio describes that relative movement, but it doesn't establish whether selling silver would improve the saver's retirement plan.
The reverse deserves equal attention. Platinum can outperform silver while still losing dollar value, so a stronger relative reading doesn't necessarily mean a profitable holding.
How to read a silver-to-platinum zone
The historical zones below are orientation points rather than trading thresholds.
| Reading zone | Relative-price story | Still check |
|---|---|---|
| Rising above the recent 40–45 band | Platinum richer versus silver, or silver weaker | Which metal moved and why |
| Near 40–45, as in 2020–2023 averages | Recent benchmark neighborhood, not a fair-value law | Recompute from today's benchmark |
| Falling toward about 30, as in October 2024 | Silver richer versus platinum, or platinum weaker | Inventories, deficits, and physical premiums |
Platinum scarcity needs particular care in interpretation. Holding silver's price unchanged, scarcity that raises platinum's price would raise this ratio, not lower it. If the ratio falls during platinum scarcity, another influence, such as stronger silver appreciation, must outweigh platinum's relative price support.
That's why the same observed reading can coexist with very different conditions. A ratio doesn't reveal whether manufacturers increased purchases, investors sold holdings, or dealers adjusted physical premiums.
The ratio describes relative value, not a forecast of profit.
Supply Deficits and Inventories Behind the Ratio
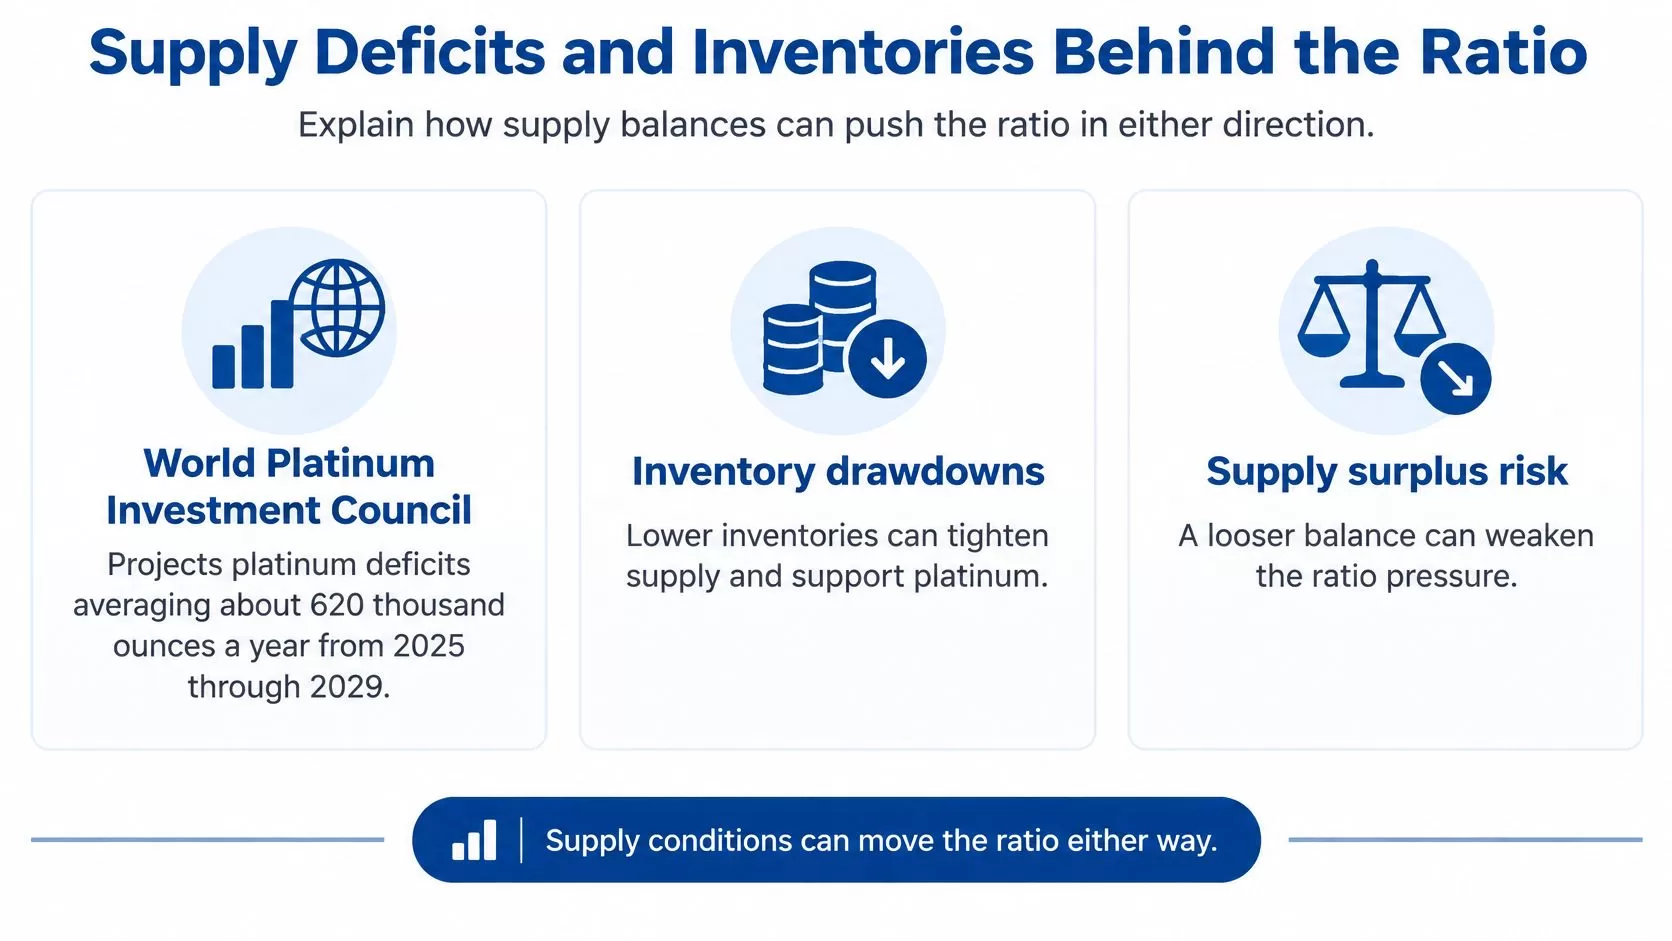
If platinum supply falls short of demand, existing inventories can fill the gap for a time. A supply deficit describes demand exceeding supply over a measured period; it does not mean the metal becomes unavailable immediately. Low inventories may leave less room to absorb another disruption, while a forecast surplus describes expected supply and demand flows, not necessarily abundant stocks everywhere.
That distinction matters when reading the ratio. A supply balance and available inventories are related, but they do not tell the same story.
Platinum forecasts can point in different directions
Forecasts vary with their time horizon and assumptions. The World Platinum Investment Council's medium-term outlook projected platinum deficits averaging approximately 620 thousand ounces annually during 2025–2029, about 8% of average annual demand. A longer-range outlook described average deficits of 331 thousand ounces during 2026–2030. These are separate forecast periods, not one unchanged estimate.
Mining is a large part of platinum supply. In its five-year supply coverage, the World Platinum Investment Council's quarterly report put primary mining at 75%–79% of annual refined platinum supply. This concentration helps explain why mine interruptions and changes in autocatalyst or jewelry recycling can affect availability.
The Silver Institute's April 2026 newsletter described a revised 2025 platinum deficit exceeding 1.4 million ounces and projected above-ground stocks equivalent to about 3.4 months of demand by the end of 2026. It also reported that 2025 silver demand fell 2% to 1.13 billion ounces, while mine production rose 3% to 846.6 million ounces, yet silver remained in deficit.
Another World Platinum Investment Council outlook projected 2026 platinum supply of 7,353 thousand ounces, including 5,551 thousand ounces of mine supply and 1,802 thousand ounces of recycling, against demand of 7,089 thousand ounces. Within that demand, automotive applications accounted for a projected 2,904 thousand ounces and jewelry for 1,883 thousand ounces. The rounded totals imply a surplus of about 264 thousand ounces. That projected surplus can sit alongside earlier deficits and low inventories, because forecasts measure flows over a period while stocks reflect accumulated past balances.
Silver has its own demand adjustments
The Silver Institute's supply-and-demand overview put 2024 total silver demand at approximately 1.16 billion ounces, with record industrial use supported by electronics, photovoltaics, automotive applications, grid infrastructure, and artificial-intelligence-related uses. Manufacturers can also reduce silver loadings through thrifting, so increased product output need not translate into matching growth in silver consumption.
Inventory perspective: A near-term surplus forecast can coexist with depleted stocks after earlier deficits.
Under the platinum-divided-by-silver convention, platinum scarcity can support a higher ratio, while silver strength can pull it lower. A platinum versus palladium comparison also helps clarify automotive exposure: platinum and palladium are not interchangeable just because both are precious metals.
Using the Ratio Inside a Precious Metals IRA
For a retirement account, eligibility and total ownership cost come before relative-price appeal. A ratio reading compares silver's price with platinum's, but it cannot show whether a specific product qualifies for an IRA or what holding it will cost.
A silver IRA overview explains the difference between exposure to a metal and the account structure used to hold it. The practical comparison is between the products available through a provider, the custodian administering the account, and the storage arrangement. Silver may be more familiar to savers researching precious-metals accounts, while platinum availability should be confirmed rather than assumed.
Compare the actual investment, not just spot prices
The ratio is a relative-price screen, not an allocation decision. The same reading could reflect platinum scarcity, a near-term surplus, or strength in silver. For an IRA, compare the actual products and costs as well as the ratio.
| Decision factor | Silver position | Platinum position |
|---|---|---|
| Product selection | Confirm the exact eligible coin or bar | Confirm product eligibility and availability |
| Trading cost | Obtain purchase and repurchase quotes | Check the purchase and repurchase spread |
| Holding cost | Review storage and custodial charges | Check storage and custodial charges |
| Portfolio role | Consider industrial and investment exposure | Consider automotive, industrial, and supply exposure |
A low reading can prompt questions about platinum availability and premiums. A high reading can prompt closer attention to silver demand and dealer pricing. Neither reading proves that one metal is undervalued or that its price will rebound.
Fit the position into the retirement plan
A precious-metals allocation is one possible diversifying slice, not a reason to move an entire retirement account into the metal that appears cheaper. Savings needed for near-term spending should be considered separately from funds intended for longer holding periods.
Metals can diversify a portfolio, but they carry price risk and ongoing fees. Prices can fall, and ownership charges continue regardless of performance.
Before a rollover, use the written product, cost, and account information checklist described in the account review process. Current IRS guidance should be checked before relying on contribution limits, distribution ages, or product lists. A provider can explain account operations, while individual tax questions belong with a qualified professional.
Frequently Asked Questions About the Silver to Platinum Ratio
How should a saver interpret a ratio move during one trading day?
A daily reading is a snapshot, not a complete explanation. Since the ratio compares platinum's price with silver's price, either metal can move the reading: platinum may rise or fall, silver may rise or fall, or both may change at once.
A single-day move can reflect a shift in one metal, a change in both, or short-term market activity. The same ratio can therefore point to platinum scarcity, a near-term surplus, or silver strength. It works as a relative-price screen, not a stand-alone allocation decision.
Can platinum be held in a precious-metals IRA?
Yes. Platinum bullion that meets applicable IRS fineness and product requirements can be eligible for a precious-metals IRA. The custodian and dealer also need to confirm that the specific product can be handled in the account.
Ask for the exact coin or bar description. Product eligibility and account handling are separate checks.
Where can a reader find benchmark prices?
The World Bank Pink Sheet provides annual and monthly commodity averages. For daily reference prices, the London Bullion Market Association (LBMA) publishes precious-metals benchmarks, including silver and platinum prices.
Check the publication timing, units, and usage terms. Annual averages help with historical context, while a current transaction quote reflects the price available for a specific trade.
Does a high ratio mean silver should replace platinum in a retirement account?
No single ratio reading settles that choice. The decision also depends on the intended allocation, the purpose of holding each metal, and the costs of selling one position and establishing another.
After considering those factors, a saver may decide not to trade. A written allocation can help keep the decision tied to the retirement plan rather than to one relative-price reading.
Retirement lens: Use the ratio to frame a question about relative prices, then assess the account decision separately.
This is not financial advice. Consult a licensed financial advisor, CPA, or tax professional before making investment decisions.
Check the Ratio Before You Allocate Savings
A ratio is a starting point for review, not an allocation decision. The same reading may reflect platinum scarcity, a near-term surplus, or stronger silver prices. A dated worksheet can keep the calculation, possible market drivers, and account costs together, making it easier to see what the figure can and cannot explain.

A practical allocation checklist
Recompute from a current recognized benchmark. Divide platinum's price by silver's price, using the same currency, weight, and timing. Record the source and observation date so the result can be checked later.
Choose a consistent historical comparison. Compare daily readings with daily history, and annual comparisons with annual history. A single low and a multiyear average provide different context, so state which comparison informs the review.
Identify which metal moved and why. Write a plain-language explanation that considers platinum inventories, silver industrial demand, and investment flows where relevant. If the driver is unclear, the ratio alone provides little basis for confidence.
Review the written IRA terms. Use the account and transaction terms already gathered to judge whether the comparison applies to the products and costs available to the account holder.
Ask qualified professionals to assess the proposed allocation. A licensed financial advisor can consider portfolio fit, while a CPA or tax professional can address the holder's tax circumstances. Include liquidity needs and the consequences of moving retirement assets.
The worksheet should support a clear reason for holding a position in the account. Expecting the ratio to return to an earlier level is not, by itself, a complete retirement-investment case.
For readers who prefer video, the accompanying resource offers another way to consider the topic.
Screening an opportunity and approving an allocation are different steps. Relative prices can prompt further investigation, while suitability depends on the specific metal, product, account, and household. A reader may decide that no trade is appropriate after considering those factors.
Gold IRA Association offers plain-language retirement-account guides and provider comparisons to help savers understand eligible metals, rollover procedures, and ownership costs. Readers can visit Gold IRA Association for educational resources on precious-metals retirement accounts.