


Why did gold climb in years when real yields were rising and the dollar looked firm? The standard answer, that falling rates lift gold and rising rates sink it, isn't wrong so much as incomplete. Gold has no single price driver. It has a handful of forces that usually pull in known directions, that often conflict with each other, and that operate on different clocks: some set the multi-year trend while others move the quote by the afternoon. For anyone holding physical metal inside a retirement account, telling those apart is the difference between reading a headline and understanding an exposure.
Gold Price Drivers at a Glance
Start with the honest answer: no single factor sets the gold price. Bullion has no earnings, no coupon and no management team, so its quote is a running referendum on several things at once. Real interest rates and a strengthening U.S. dollar usually weigh on gold. Rising inflation expectations, central bank buying, ETF inflows and geopolitical stress usually support it. Mine supply and recycling add metal to the market slowly, which means they cap and cushion moves over time rather than ignite them.
Here is the working map. Each driver is paired with its usual direction and the indicator a reader can check without a trading terminal.
| Driver | Usual effect on gold | Indicator to watch |
|---|---|---|
| Real interest rates | Usually negative when rising | 10-year Treasury yield minus expected inflation |
| Inflation expectations | Usually positive when rising | Breakeven inflation rate |
| U.S. dollar strength | Usually negative when strengthening | DXY dollar index |
| Central bank buying | Positive, steady support | Quarterly World Gold Council demand data |
| ETF inflows and outflows | Positive with inflows, negative with outflows | Gold ETF holdings reports |
| Geopolitical risk | Usually positive during crises | Sanctions, conflicts and safe-haven flows |
| Mine supply and recycling | Caps rises over time | Quarterly mine output and scrap volumes |
Read those rows as tendencies, not formulas. Drivers routinely pull against each other, and the price you see is the net of the argument. A period of rising real rates paired with heavy official-sector accumulation can produce a flat or higher gold price that the rate-only model would have called wrong. The table tells you which forces are in play, not who wins.
The metal's price also sets floors in markets far from bullion. Anything priced by weight carries the same input, and the luxury watch value floor explained analysis from ECI Jewelers is a clear look at how the 2025 to 2026 surge reset the minimum value of secondhand timepieces.
How to use the table in two steps: first identify which drivers are actually moving this month, then ask whether they point the same way. When three or more align, the move tends to last. When they scatter, expect chop.
Real Rates and Inflation Expectations Move Gold
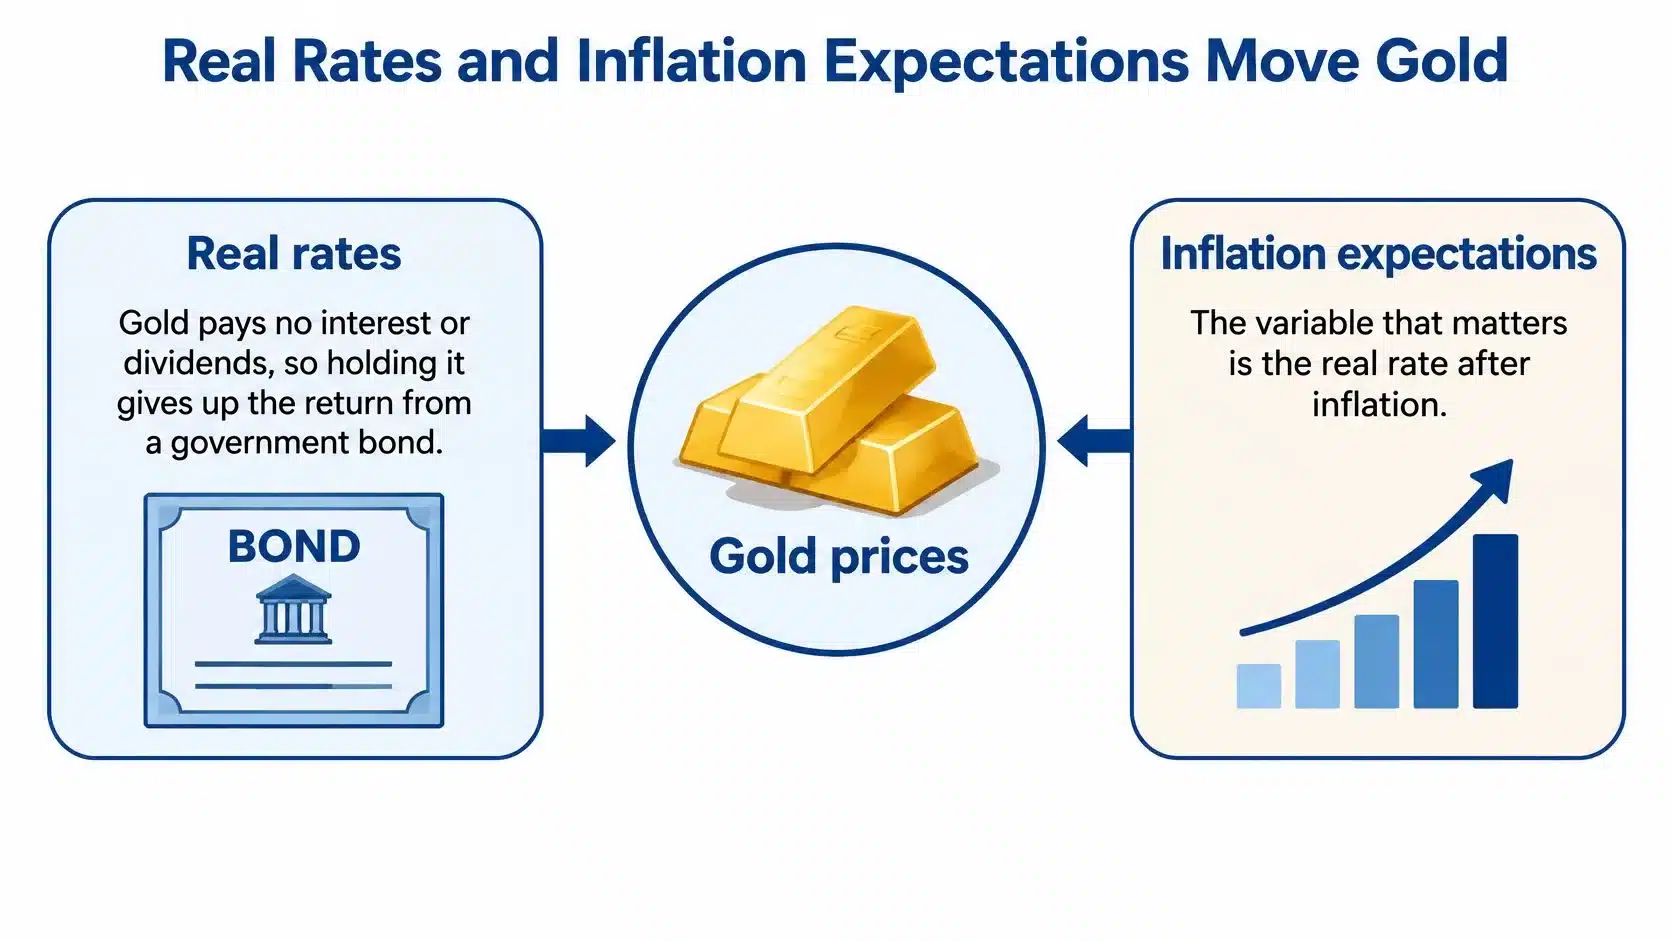
Gold pays no coupon and no dividend. An investor who holds bullion instead of a government bond gives up whatever that bond yields after inflation, and that forgone return is the most reliable long-run anchor on the gold price. The Federal Reserve Bank of Chicago describes gold as a long-duration asset whose price should have a strong inverse relationship with expected real interest rates: when real rates rise, gold becomes relatively less attractive, and when they fall, its appeal increases (Chicago Fed Letter 464).
That mechanism is simple enough to draw.
Why the Real Yield Beats the Headline Rate
The variable that matters is the 10-year Treasury yield minus expected inflation, not the nominal rate quoted in the news. The practical way to read expected inflation is the breakeven inflation rate, the gap between nominal Treasury yields and the yields on inflation-protected Treasuries of the same maturity. That gap is what the bond market is charging for inflation protection.
This distinction explains outcomes that look contradictory. A nominal yield increase accompanied by an even larger rise in inflation expectations lowers the inflation-adjusted yield, which supports gold. A nominal increase driven by tighter financial conditions raises the inflation-adjusted yield, which pressures it (Chicago Fed model documentation). Markets react to surprises in the inflation outlook, not to the latest CPI print, because the print is already in the price.
How Sensitive Is Gold to a Point of Real Yield?
| Rate change | Estimated gold price effect | Source |
|---|---|---|
| 1-point rise in expected 10-year real rate | About 3.4% lower real gold price | Chicago Fed model |
| 1-point rise in long-term real rates | About 13.1% lower real gold price | Chicago Fed longer-run estimate |
| 25-basis-point fall in U.S. 10-year yield | About 1.75% higher gold price | World Gold Council analysis |
The short-run estimate and the longer-run estimate differ by roughly a factor of four, which tells you something important: the market adjusts gradually, and the full effect of a rate shift shows up over years, not sessions. The World Gold Council's own sensitivity work puts a 25-basis-point decline in the U.S. 10-year yield at roughly a 1.75% increase in gold, a smaller and more tactical figure that reflects how much else is moving at the same time (World Gold Council mid-year outlook).
For a plain walkthrough of the same transmission channel:
The 1971 to 1980 Test Case
The cleanest natural experiment came after the Bretton Woods exchange-rate system ended. The U.S. dollar price of gold became freely variable in 1971, and the sharp increase in inflation expectations through 1971 to 1980 coincided with a major gold-price advance. Gold behaved as a store of value precisely when holders expected money's purchasing power to deteriorate.
Take a near-retiree holding a 10% gold allocation in a $900,000 portfolio. If expected 10-year inflation-adjusted rates rise a full point, the Chicago Fed's short-run estimate implies roughly a 3.4% decline in the inflation-adjusted gold price, about $3,060 off a $90,000 position, before dealer spreads. The longer-run estimate is far harsher. Neither number is a forecast; both describe a partial equilibrium in which nothing else moves.
Counterweights are real. Recession fear, geopolitical stress and reserve diversification can offset higher real yields entirely, which is why the relationship between gold and inflation is worth studying in both directions rather than as a one-way bet. Gold's sensitivity is greatest around changes in the expected path of monetary policy, not around announced rate levels that everyone already knows.
Dollar Strength and Central Bank Buying
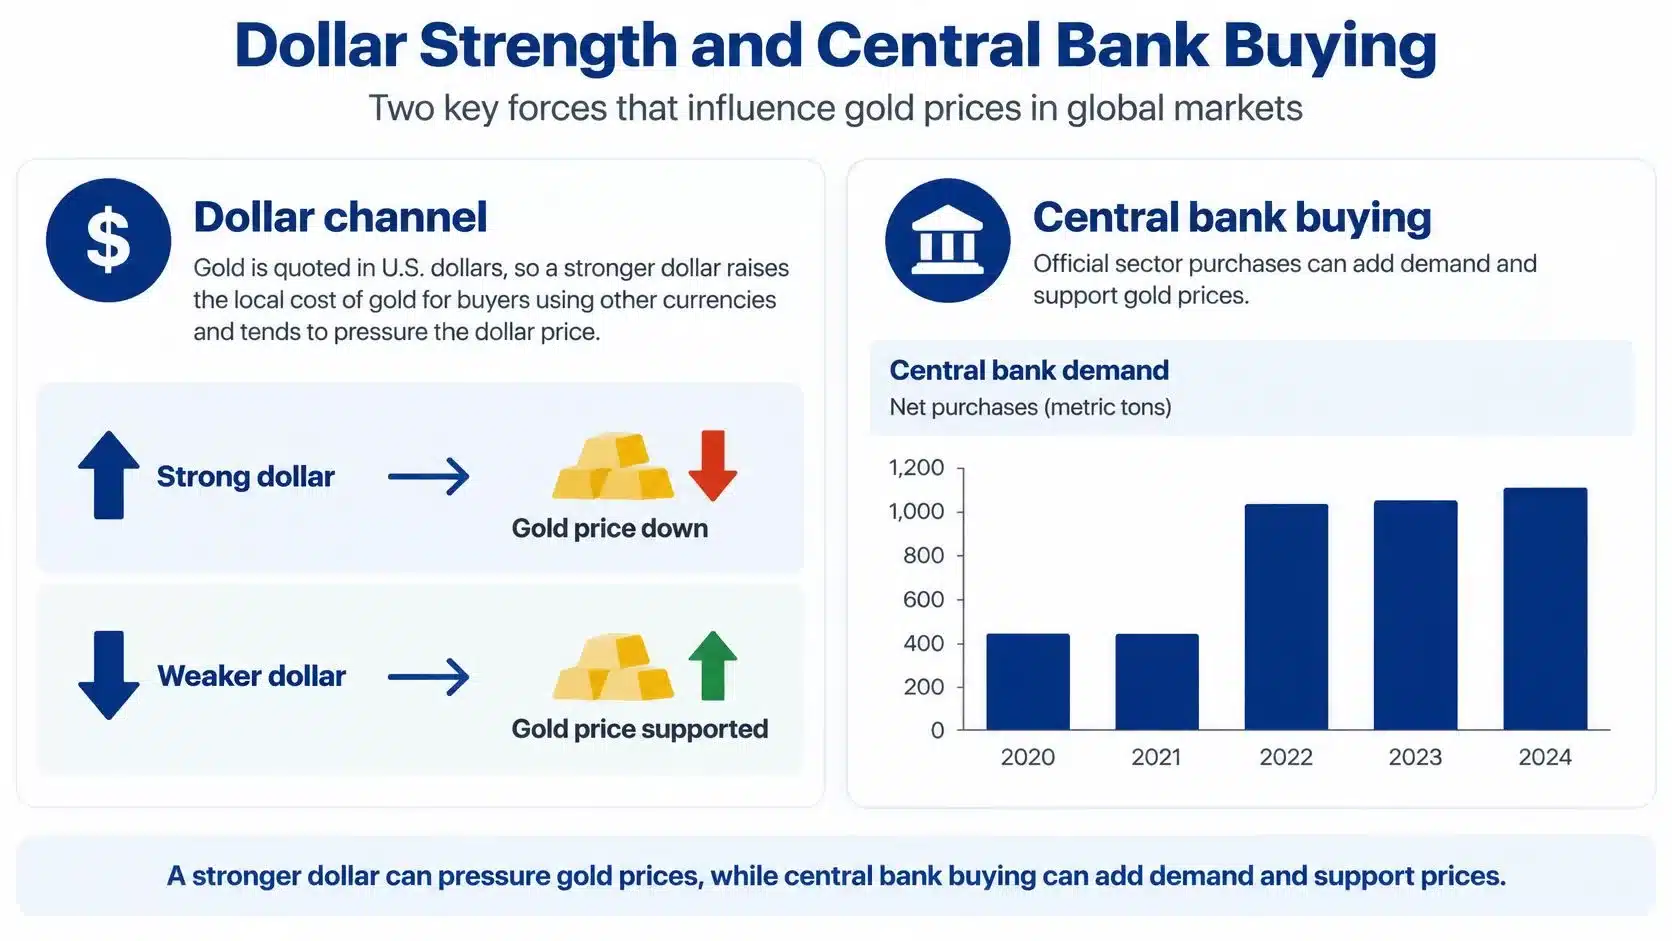
Gold is quoted in U.S. dollars, so the currency itself is a price input. When the dollar strengthens, the local-currency cost of gold rises for buyers in euros, yen or rupees, which tends to dampen demand and pressure the dollar price. When the dollar weakens, those buyers get more metal for the same money and the dollar price tends to firm. The DXY dollar index is the standard comparison, and tracking gold against it over rolling three-month windows tells you quickly whether currency or something else is driving the tape.
The Official Sector Changed the Math
Central banks and other official institutions bought a net 1,135.7 tonnes in 2022, against 450.1 tonnes in 2021. That's a 152% year-over-year increase and the highest annual level of central-bank demand in the World Gold Council's historical series back to 1950 (World Gold Council central bank data).
| Year | Net central bank purchases (tonnes) | Context |
|---|---|---|
| 2021 | 450.1 | Baseline before the 2022 surge |
| 2022 | 1,135.7 | Up 152% year over year and the highest level since 1950 |
| 2023 | About 1,037 | Elevated, slightly below the 2022 record |
The buying held at historically high levels in 2023, only slightly below the record. The World Gold Council attributed the 2022 surge to geopolitical uncertainty and high inflation, and central-bank surveys consistently rank gold as a crisis performer, a long-term store of value and a portfolio diversifier.
Why Official Buying Acts Like a Floor
Reserve managers aren't traders. They hold large strategic portfolios, buy in size, and are far less price-sensitive than an ETF investor watching a screen. A central bank diversifying away from concentrated currency exposure buys because of sanctions risk, reserve security and inflation, not because the 10-year real yield ticked up 20 basis points. That makes official demand a demand floor that can hold even when conventional signals turn unfavorable.
The clearest recent example of that motive is the why China's central bank buys gold breakdown from The Coin Course, which traces reserve diversification rather than price timing as the driver. The China gold buying picture matters for U.S. holders because official purchases outside the dollar bloc change who sets the marginal price.
The divergence signal: when the dollar and real yields both point one way and gold moves the other, reserve demand is probably dominating. That's a cue to check the latest quarterly official-sector data before assuming the price is wrong.
Geopolitical Risk and Safe-Haven Demand
Conflict, sanctions and financial stress push some investors toward gold as a store of value and a hedge against tail risk. That safe-haven buying can lift the price even when real yields are high, because the buyer isn't comparing gold to a bond. The buyer is comparing gold to everything else.
Geopolitical risk travels through three channels. The first is investor safe-haven buying, which shows up as ETF inflows within days of a shock. The second is official-sector buying driven by reserve security and sanctions concern, which is slower and larger. The third is the currency response, when confidence in a major currency weakens and reserve managers rebalance.
The effect has limits worth naming. It's usually strongest early in a shock and fades once markets settle, so a headline alone predicts very little about a sustained move. Gold can also fall during a crisis, either because investors sell liquid holdings to raise cash or because a sharp dollar rally overwhelms the safe-haven bid.
Track three things during an event window: major conflict and sanctions announcements, central bank reserve reports, and ETF holdings changes over the following four to six weeks.
The honest framing is that geopolitical effects are hard to measure precisely. There's no clean counterfactual for a war, so the relationship is a tendency, not a forecast, and it belongs in a portfolio as a reason to hold some metal rather than as a reason to trade around headlines.
ETF Flows and Investor Demand
Here's the assumption worth challenging: that a falling-yield environment automatically lifts gold. It doesn't, at least not on a timetable anyone can trade. Investment flows often set the short-term price, and they can do it while jewelry demand weakens and real yields sit still.
The numbers make the case. Global gold-backed ETF holdings increased by 801 metric tons in 2025, reaching an all-time high of 4,025 tons, while total investment demand rose 84% to a record 2,175 tons (World Gold Council Gold Demand Trends full year 2025).
How a Share Purchase Becomes a Metal Purchase
The transmission is mechanical. When investors buy ETF shares, the fund buys bullion. When they redeem, metal is released back into the wholesale market. A large creation or redemption moves the physical market directly, which is why ETF holdings reports often explain price moves that rate models can't.
It helps to separate two kinds of demand:
- Structural demand: long-term portfolio allocation, pension and institutional positions that turn over slowly.
- Marginal demand: the flows that set the clearing price this week, driven by positioning, headlines and rebalancing.
Prices move at the margin. A durable allocation can grow for years without moving the quote much, while a single month of heavy redemptions can knock it down hard.
Why Falling Yields Don't Guarantee a Rally
The World Gold Council reported that investors became less sensitive to long-bond yields, partly because stock-and-bond correlations remained unusually high. When bonds stop hedging equity risk, the case for gold as the diversifier strengthens, and buyers respond to that case rather than to the yield curve. That's the answer to the question of why gold sometimes rises when the usual interest-rate explanation seems insufficient.
For a physical IRA holder, the connection is indirect. IRA metal doesn't receive ETF inflows. Its value moves through the wholesale gold price, then gets adjusted by dealer spreads, storage costs and the timing of transactions. A strong flow month won't show up in an account statement as a flow; it shows up as a different spot price when you buy or sell.
Review ETF holdings data monthly, but treat a single month as noise. Two or three consecutive months in the same direction is a signal.
Mine Supply and Recycling Limits
Two very different mechanisms put metal into the market. Mining adds gold that has never been above ground, and it responds slowly because a new mine takes years to permit, finance and build. Recycling returns metal that already exists, and it responds fast because it depends on whether owners decide to sell.
World Gold Council data for the third quarter of 2026 shows both channels clearly. Mine production reached 1,071 metric tons, up 3% year over year and a quarterly record, while recycled gold fell 8% year over year to 314 metric tons. Total supply was approximately 1,369 metric tons, broadly matching reported total demand including over-the-counter activity (World Gold Council Gold Demand Trends Q3 2026).
Why Supply Can't Drive a Rally
Higher prices don't produce new mines on a useful timeline. They produce feasibility studies, then permits, then construction. By the time new output arrives, the cycle that justified it has usually turned. This is why supply shifts are gradual and tend to moderate price moves rather than trigger them.
Recycling is the responsive half. High prices bring scrap gold to market as households sell old jewelry and coins, which adds supply exactly when prices are strongest and cushions the top of a rally. The 8% year-over-year decline in recycled volumes in that quarter is the mirror image: when owners are reluctant to sell, that cushion thins.
What supply data is good for: sizing the market and spotting tightness in the recycling channel. It is not a standalone predictor of price direction.
For a holder, the practical takeaway is modest. Supply tells you the market is deep and liquid, not that the price is about to move. Watch quarterly mine output and recycling volumes in the World Gold Council reports, and treat any single quarter as context rather than a trigger.
Confirm Your Gold IRA Exposure Before You Act
All of these drivers reach a physical Gold IRA the same way. The account holds metal priced off the wholesale gold price, so real yields, the dollar, inflation expectations and fund flows affect the value indirectly. What sits between that price and your statement is the part you control: dealer premiums over spot, annual storage fees and custodial charges. Two accounts holding identical coins can produce different net outcomes purely because of what those layers cost.
Tax treatment adds another variable. Gold and silver held in a retirement account follow different rules from metal held outside one, and outcomes depend on the account type and individual circumstances. Gold IRA Association publishes background on both sides of that question, including "Capital Gains Tax on Gold: A Plain-English Guide" and "Tax on Silver: What Retirees Must Know," and the how much gold should I own guide is a reasonable starting point for sizing a position before cost layers enter the discussion.
Four items are worth reviewing before adding or trimming exposure:
- Real yield trend: is the 10-year Treasury yield minus expected inflation rising or falling over the past six months?
- Dollar trend: is the DXY strengthening or weakening against a basket of major currencies?
- Breakeven inflation: are inflation expectations drifting up or down?
- Flow direction: are ETF holdings and central bank purchases expanding or contracting quarter over quarter?
When all four align, the case for a position is cleaner. When they conflict, that's information too, and it usually argues for patience rather than a large one-time purchase.
Compliance note: the materials here are informational and are not financial, legal or tax advice. Investing in precious metals and IRAs involves risk, including the potential loss of principal.
One next step makes sense if you're weighing a physical allocation. A specialist can walk through account structure, fee layers and the rules that apply to your situation at 888-910-8386, and a licensed financial advisor or CPA should review the decision before any money moves.
Gold IRA Association is an independent educational resource built for readers who want to understand what moves precious metals before committing retirement money to them. Alongside plain-English explainers like this one, it publishes topic sections on gold IRA rules, rollovers, silver IRAs, eligible coins and bars, and side-by-side company comparisons that focus on credibility, fees and service. If you'd like to keep tracking these drivers with fresh context on inflation and market volatility, visit Gold IRA Association and work through the guides at your own pace.